“小小奇迹”不再:美国劳动收入占比下降
A Bit of a Miracle No More:The Decline of the Labor Share
How is income divided between labor and capital? Every dollar of income earned by U.S. households can be classified as either labor earnings — wages and other forms of compensation — or capital earnings — interest or dividend payments and rent. The split between labor and capital income informs economists’ thinking on several topics and plays a key role in debates regarding income inequality and long-run economic growth. Unfortunately, distinguishing between labor and capital income is not always an easy task.
收入是如何在劳动和资本之间分配的?美国家庭所赚取的每一块钱都可以被归类为劳动收入(工资或其它形式的劳动补偿)或资本收益(利息、股利和租金等)。收入在劳动和资本之间的分配为经济学家们关于许多经济学议题的思考提供了重要信息,并且在关于收入不平等和长期经济增长这些问题的争论中扮演着核心角色。不幸的是,将劳动收入与资本收入区分开并非总是一件易事。
Until recently, the division between labor and capital income had not received much attention. The reason was quite simple: Labor’s share never ventured far from 62 percent of total U.S. income for almost 50 years — through expansions, recessions, high and low inflation, and the long transition from an economy primarily based on manufacturing to one mainly centered on services.
一直以来,区分劳动收入和资本收入的问题并没有受到太大关注,直到最近才有所改观。原因很简单:在将近50年中,美国劳动收入在总收入中所占的比例从来不会偏离62%这个数字太远——不论经济是在扩张还是衰退,也不论通胀率是高是低,在美国经济从以制造业为基础向主要以服务业为核心的漫长转变过程中,这个比例一直很稳定。
As it happened, the overall labor share remained stable as large forces pulling it in opposite directions canceled each other out — a coincidence that John Maynard Keynes famously called “a bit of a miracle.” But the new millennium marked a turning point: Labor’s share began a pronounced fall that continues today.
劳动收入占比在多种强大力量的反向拉扯和相互抵消之下总体保持了稳定这件事情本身——按照约翰·梅纳德·凯恩斯的著名说法——可以称得上是个“小小奇迹”。但是新千年的到来却标志着一个重要的转折点:劳动收入占比开始明显下降,并且这个趋势一直持续到了现在。
Why did the labor share lose its “miraculous” stability and embark on a steep decline? To investigate this shift, economists must first be sure they are measuring the labor share correctly. Could measurement problems distort our understanding of what has happened to the labor share over time?
为什么劳动收入占比会失去它“奇迹般”的稳定性而开始急剧下降?要研究这一转变,经济学家们的首要任务是确保他们测量劳动收入占比的方法是准确的。测量方法存在问题会歪曲我们对于长期以来劳动收入占比所发生的变化的理解吗?
In this article, I explain the inherent challenges in measuring the labor share and introduce several alternative definitions designed to address some of the measurement problems. As we will see, the overall trend is confirmed across a wide range of definitions.
在这篇文章中,我将解释在测量劳动收入占比时所面临的内在挑战,并介绍几种旨在解决其中一些测量问题的替代性定义。正如我们将看到的,基于一系列不同定义的测量结果都证实了劳动收入占比总体上的下降趋势。
Economists do not yet have a full understanding of the causes behind the labor share’s decline. We can make some progress, though, by noting the impact of wage and productivity trends and shifts between industries. Finally, I discuss several popular hypotheses, based on concurrent phenomena, such as widening wage inequality and globalization, that may account for the labor share’s sharp decline.
经济学家们至今还未能全面地理解劳动收入占比下降背后的原因。即便如此,通过研究工资和生产率的变化趋势以及产业的变迁,我们仍然可以取得一些进展。最后,我将讨论一些流行的假设。这些基于诸如薪资不平等程度加深以及全球化等并发现象的假设也许能解释劳动收入占比的急剧下降。
MEASURING THE U.S. LABOR SHARE
测量美国的劳动收入占比
By construction, all income accounted for in the U.S. economy must be earned either by capital or labor. In some cases, we can easily see whether our income comes from labor or capital: when we earn a wage or a bonus through our labor or when we earn interest from our savings or investment account, which is attributed to capital income, despite the fact that most of us would not think of ourselves as investors.
从定义上说,美国经济中任何的收入要么被资本赚取了,要么就是被劳动赚取了[i]。在一些情形中,我们可以很容易地看出我们的收入是来自于劳动还是资本:当我们通过劳动赚到一份工资或者奖金时,这部分收入显然来自于劳动;虽然我们中的大部分人并不认为自己是投资者,但当我们从储蓄或投资账户中获得利息或投资收益时,这部分收入很明显应该被归为资本收入。
However, it is not always immediately apparent that all income eventually accrues to either capital or labor. For example, when we buy our groceries — creating income for the grocer — we are only vaguely aware that we are also paying the producers, farm workers, and transporters as well as for the harvesters, trucks, trains, coolers, and other capital equipment involved in producing and distributing what we purchase. However, when the Bureau of Economic Analysis (BEA) constructs the national income and product accounts, it combines data from expenditures and income to ensure that every dollar spent is also counted as a dollar earned by either capital or labor.
然而,所有的收入最终都会被归为资本收入或劳动收入这一点并不总是那么显而易见。举个例子,当我们从杂货店里买东西时——这显然为杂货店主创造了收入——我们仅仅模糊地意识到我们所付的钱同样也为货物的生产者、农场工人、运输工人创造了收入,除此以外,我们还为投资于收割机、卡车、制冷装置和其它一些参与我们所购买货物的生产和分销过程的设备的资本创造了收入。而国家经济分析局(BEA)在构建国民收入和生产账户时将来自支出和来自收入的数据合并在一起,以保证任何一美元的支出也同样要么被资本赚取,要么被劳动赚取。
Of course, nothing is ever so simple economic statistics. First, we lack the detail necessary to split some components of the income data between labor and capital returns. As I will show, the foremost example is the income of self-employed workers, who simply collect the income of their business without distinguishing whether it resulted from their work or their investment. In addition, the housing and the government sectors have their total income arbitrarily assigned as labor and capital income, respectively, in the national income accounts.
当然,经济统计中从来不会有这么简单的事情。首先,我们缺乏将收入数据的某些组成部分划分为劳动或资本回报的一些必要细节。正如我将说明的,这其中最典型的例子就是那些个体经营者的收入,他们仅仅从自己的生意中获得收入,而不区分这些收入是自己的劳动成果还是投资收益。此外,住房部门和政府部门在划分各自国民收入账户中属于劳动收入和资本收入的部分时也都很随意。
The Bureau of Labor Statistics (BLS) publishes the most widely used estimate of the labor share, which combines several data sources and estimates in order to get around some of the measurement problems. However, these problems remain significant enough that economists routinely create alternative definitions and compare results across them, since a single definition of the labor share is unlikely to fit all purposes.
目前使用最广泛的关于劳动收入占比的估计是由国家劳动统计局(BLS)发布的,它将来自多个数据源的数据和估值放在一起,以规避一些测量方法上的问题。但即便如此,这些测量上的问题还是带来了足够明显的影响,这使得经济学家们通常会创造一些对于劳动收入占比的不同定义,并将这些定义下的结果进行比较,因为单一的定义方法不可能适合所有的测量目的。
And what would these purposes be? First, workers and investors respond differently to the same economic conditions and policies. So if we wish to understand how aggregate output will respond, we need to know how to weigh the responses of workers and investors.
那么测量劳动收入占比的目的又有哪些呢?首先,劳工和投资者对于相同的经济状况和政策的反应是截然不同的。所以如果希望了解某种经济状况和政策将如何影响加总的产出,我们就需要知道如何分别衡量劳工和投资者的反应的权重。
Second, assets are notoriously unevenly distributed across households; hence, an increase in the share of income earned by capital contributes to income inequality, as richer households would receive an even larger share of total income.
其次,资产在家庭之间的不均分布一直以来都饱受诟病,而资本收入占比的上升会加深收入不平等的程度,因为更富裕的家庭会在总收入中获得更大的比例。
Third, the tax code treats labor and capital income differently. Labor income is subject to payroll taxes and the usual income tax rate schedule. Corporate profits (the main source of capital income) are subject to corporate taxes as well as dividends and capital gains taxes when profits are distributed to households. A shift in the labor share will impact not only tax revenues but also how the burden of taxation is distributed across households.
第三,税法在对待劳动收入和资本收入时所采用的税收政策是不同的。劳动收入所适用的是工资税和普通的所得税率表。公司利润(资本收入最重要的来源)所适用的则是公司税。而当公司利润被分配给家庭时,这部分利润所适用的则是股利和资本利得税。劳动收入占比的变化不仅将会影响税收的总额,而且还会影响到不同家庭所承担税赋的份额。
Economists also need an estimate of the labor share when determining how much of economic growth can be attributed to labor force growth, capital accumulation, or technological changes — which in turn are key inputs for long-term growth forecasts.
此外,经济学家们也需要对劳动收入占比进行估算来确定经济增长分别在多大程度上可归因于劳动力增长、资本积累以及技术进步——这些因子又都是对长期经济增长进行预测所需的重要变量。
Components of income
收入成分法
The BEA measures output, or gross value added, two different ways in its national income and product accounts (NIPA). The expenditure approach aims to measure the total amount spent on goods and services throughout a year; the income approach instead adds up all the income earned by households. In theory, both measures should yield the same number. In practice, alas, they do not. The discrepancy is due to data limitations and measurement error, though the discrepancy is quite small.
国家经济分析局使用两种方法来测量国民收入和产出账户(NIPA)的总产出(也称总附加值)[ii]。支出法的目标是测量一年中花费在产品和服务上的总支出额;而收入法则将家庭部门的所有收入加总在一起。理论上,两种方法所得到的最终数值应该是相同的。但遗憾的是,实际并非如此。两者间的差异是由数据局限和测量误差所导致的,虽然这个差异其实很小。
The labor share is measured using the income approach. Every dollar of output must be earned by factors of production and distributed to households. What exactly is a factor of production? Were we to measure the output of a factory, we would count as factors of production the workers and managers, all the equipment, the building and land occupied by the factory as well as the electricity, security service, and all the other intermediate inputs used.
劳动收入占比这个指标是使用收入法测得的。总产出中的每一美元都会被各种生产要素所赚取,并最终分配到家庭手中。而生产要素到底是什么呢?在测量一家工厂的产出时,我们会把工人和经理人,所有的设备,工厂所占据的建筑和土地,以及电力,安保服务和所有其他中间投入都当作生产要素。
But because we are measuring the output of the whole economy, we must recognize that the intermediate goods, utilities, and services were produced by some other firm, which in turn uses its own factors of production. Were we to check with, say, the firm producing electricity, we would once again find some workers and managers, equipment, and so on. Now, we could try to track each and every input of production in the U.S., but we would quickly realize that the only factors of production whose income accrues directly to households are labor and capital.
但是由于我们所测量的是整个经济的总产出,我们必须认识到那些中间产品、设施和服务实际上都是由另外的一些企业生产的,而那些企业在生产过程中又会用到它们自己的生产要素。如果我们去看看另一家企业——比如说生产电力的公司——的生产要素,我们会再一次找到一些工人和经理人,生产设备以及其它种种要素。我们可以尝试去追踪美国经济产出中的每一项投入,但是我们会迅速意识到,只有两种要素——劳动和资本——产生的收入将直接归属于家庭收入。
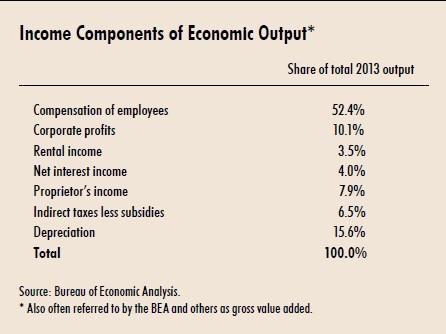
The BEA classifies output into seven groups, as detailed in the table. The second column provides the share of each component relative to the total for 2013. The classification of most income sources as capital or labor income is quite unambiguous. For example, compensation of employees clearly accrues to labor, while corporate profits, rental income, and net interest income are returns to capital. Of the three remaining components, the main challenge is proprietor’s income.
国家经济分析局将产出分为7个大类,如下表所示。表的第二列提供了2013年各个大类占总体的比重。将大多数的收入来源归为劳动收入或资本收入的这种分类方法实际上是相当明确的。举例来说,对雇员的劳动补偿很显然应该归为劳动报酬,而企业利润、租金收入和净利息收入都属于资本收入。在剩下的三个大类中,最主要的挑战是如何界定经营者收入的性质[iii]。
Proprietor’s income is defined as the income of sole proprietorships and partnerships — in other words, the income of self-employed individuals. There is no question that their income is the result of both labor and capital. For example, a freelance journalist may work long hours to document and write a story using a computer and a camera that she or he financed through savings. However, self-employed individuals have no need, economic or fiscal, to distinguish between wages and profits. However, economists do.
经营者收入被定义为个人独资以及合伙企业的收入——换句话说,也就是个体经营者的收入[iv]。毫无疑问,他们的收入同时是劳动投入和资本投入的结果。举例来说,一名自由记者可能会为了撰写一篇报导工作很长时间,而他使用的电脑和相机则是用自己的积蓄购买的。但是,个体经营者完全没有经济或财务上的理由将自己的收入区分为工资和利润。遗憾的是,经济学家们却需要这么做。
The main BLS measure
国家劳动统计局的主流测量方法
The BLS is well aware of these problems and goes to great lengths to disentangle proprietor’s income into its labor and capital income components. First, the BLS uses its data on payroll workers to compute an average hourly wage. The BLS then assumes that a self-employed worker would pay himself or herself the implicit wage rate. Then, using data on hours worked by self-employed workers, it obtains a measure of the labor compensation for self-employed individuals simply by multiplying the average hourly wage by the number of hours worked by the self-employed. The result is then assigned to labor income. The rest of the proprietor’s income is considered capital income.
国家劳动统计局对这些问题心知肚明,它在如何将经营者收入分解为劳动收入部分和资本收入部分这个问题上走得更远。首先,它使用领薪劳工的数据计算出一个平均时薪。然后假设一名自雇者将会按照这个时薪来给自己发工资。之后,使用自雇工人工作时长的数据并通过简单地将自雇者的平均时薪和工作时长相乘,国家劳动统计局就获得了对自雇者劳动报酬的测量数据。这个结果会被归为劳动收入,而这名经营者收入中的剩余部分则被认为是资本收入[v]。
Figure 1 plots the BLS’s headline labor share at an annual frequency from 1950 to 2013. Up until 2001, the labor share displayed some ups and downs, and perhaps a slight downward trend, but it never strayed far from 62 percent. From 2001 onward, though, the labor share has been steadily decreasing, dropping below 60 percent for the first time in 2004 and continuing its fall to 56 percent as of 2014.
图1描述了按国家劳动统计局主流方法计算出的自1950年到2013年的年度劳动收入占比[vi]。直到2001年,劳动收入占比一直都在一个很轻微的下行趋势中起起落落,但是它从来没有离62%这个数字太远。但自2001年以后,劳动收入占比一直在持续下降,在2004年首次跌破60%,并一直持续跌落到2014年的56%[vii]。

An alternative measure
一种替代测量方法
Michael Elsby, Bart Hobijn, and Aysegul Sahin have pointed out that some of the fall in the labor share in the past 15 years is due to how the BLS splits proprietor’s income. Indeed, until 2001, the BLS’s methodology assigned most of proprietor’s income to the labor share, a bit more than four-fifths of it. Since then, less than half of proprietor’s income has been classified as labor income.
Michael Elsby, Bart Hobijn和Aysegul Sahin指出,劳动收入占比在过去15年中的下降可部分归因于国家劳动统计局分割经营者收入的方法。事实也的确如此,直到2001年,国家劳动统计局都将经营者收入中的大部分归为劳动收入,比例略高于五分之四。而2001年之后,经营者收入中仅有不到一半的比例被归为劳动收入。
How important is this shift? It is fortunately very easy to produce an alternative measure of the labor share in which a constant fraction of proprietor’s income accrues to labor. Setting that fraction to its historical average prior to 2000 — 85 percent — we can figure out what would be the current labor share under this alternative assumption.
这一变化的影响有多大?幸运的是,我们可以很容易地用一种替代测量方法来对劳动收入占比进行估值,这种方法就是把业主收入按照一个固定比例计算为劳动收入。如果将该比例设定为2000年以前的历史平均值——85%——我们就能计算用该替代方法测量的当前的劳动收入占比。
Figure 2 contrasts the previous headline number against this alternative measure from 1980 onward.
图2对比了国家统计局公布的自1980年以来的劳动收入占比和使用替代方法得到的同时期劳动收入占比。
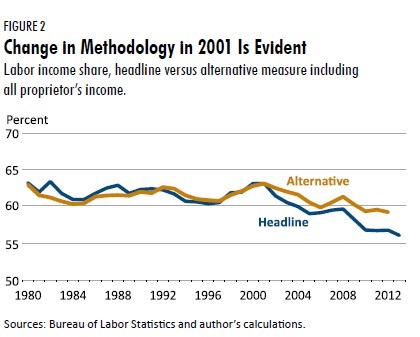
First, we confirm that through 2000, both the headline and the alternative measure pretty much coincide. Since 2001, though, they diverge, with the drop being noticeably smaller in the alternative measure. Indeed, this divergence suggests that at least one-third and possibly closer to half of the drop in the headline labor share is due to how the BLS treats proprietor’s income.
首先,我们确认直到2000年,按国家劳动统计局的主流方法和这里的替代方法得到的结果基本是吻合的。而自从2001年开始,两者之间的差异开始扩大。按替代方法计算的结果中,劳动收入占比的下降幅度明显要小得多。两者间的差异事实上表明,按国家经济统计局的主流方法计算所得的结果中至少三分之一,甚至很可能接近一半的劳动收入占比降幅是由该方法对待经营者收入的方式所引起的。
Alternatively, we can also proceed by the centuries-tested scientific method of ignoring the problem altogether and compute the compensation or payroll share instead of the labor share. That is, we can assume that none of proprietor’s income accrues to labor.
另外,我们还可以采用一种经过多个世纪检验的“科学方法”——彻底忽略以上不同测量方法的问题,仅仅计算受雇劳工获取的劳动报酬占比,而不计算劳动收入占比。那么,我们就可以假设,经营者的所有收入都不会被归为劳动收入。
This is actually a quite common approach, since detailed payroll data exist for all industries, allowing us to pinpoint which sectors of the economy are responsible for the dynamics of labor income. The compensation share is, obviously, lower than the labor share — but its evolution across time is very similar: stable until the turn of the millennium and a decline since then.
实际上这也是一种很常用的方法。由于所有的行业都有非常详细的工资单数据,这让我们能够详细地查明经济中的哪些部门对劳动收入的变化产生了影响。劳动报酬收入占总收入的比重显然要低于总的劳动收入,但是它随时间变化的轨迹与劳动收入占比的变化轨迹非常相似:在新千年到来之前一直都很稳定,而从那以后就开始持续下降。
Yet another measure
另一种替代测量方法
There is yet another possible way to circumvent the ambiguity regarding proprietor’s income. The data allow us to zoom in to the non-financial corporate business sector. By law, corporations must declare payroll and profits separately for fiscal purposes, so there is actually no proprietor’s income. The downside is, of course, that we are working with only a subset of the economy, albeit a very large one.
还有另外一种可能的方法可以绕过处理经营者收入时面临的模棱两可问题。数据让我们可以更仔细地观察非金融企业部门。在法律上,由于财务方面的原因,公司必须分开报告工资单和利润,因此实际上这里就不存在经营者收入这个概念。但这个方法的缺点在于,我们只能研究整体经济中的一个子集,尽管这是一个相当大的子集[viii]。
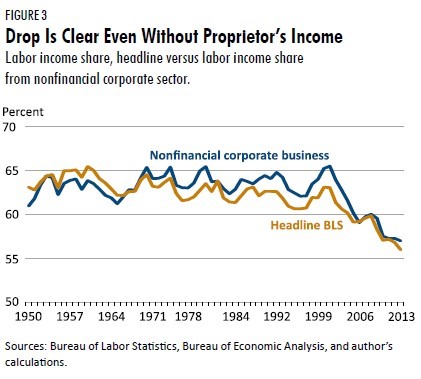
Figure 3 plots the BLS headline measure and the labor share of income of the non-financial corporate sector from 1950 to the latest data available. The two series overlap for most of the period, though the headline labor share was consistently about 1 percentage point below that of non-financial firms from 1980 onward. In any case, the message since 2000 is unmistakable: The large drop in the headline measure is fully reflected in this alternative measure.
图3描述了从1950年开始到最近可获取数据的时间段内,分别使用国家劳动统计局的主流方法和非金融企业部门的劳动收入占比数据所得到的结果。虽然自1980年开始,主流方法测得的的劳动收入占比相对非金融企业中的劳动收入占比一直都低了1%左右,但在大多数时间段内,两条曲线的走势都是趋同的。不论在哪种情形下,2000年以来的数据所传递的信号都是明确无误的:主流方法中劳动收入占比的巨大降幅在这种替代方法中也得到了完全的反映。
So, despite the inherent measurement problems, the data are clear: First, the labor share was stable from 1950 to at least near the end of the 1980s. Second, it has fallen precipitously since 2001. While the exact magnitude of the drop may be open to debate, there is no doubt that the downward trend in the labor share since 2001 is unprecedented in the data and, at the time of this writing, shows no signs of abating.
所以如果将这些测量方法所固有的问题放在一边,数据的含义是非常清晰的:首先,从1950年到至少1980年代末,劳动收入占比一直都保持了稳定。第二,从2001年开始,劳动收入占比开始急剧下降。虽然精确的降幅到底是多少仍然有待讨论,但毫无疑问的是,从数据看来,2001年之后的劳动收入占比下降趋势是前所未有的。而直到撰写本文时,这个趋势也丝毫也没有减弱的迹象。
A BIT OF A MIRACLE: 1950-1987
“小小奇迹”:1950-1987
We now take a closer look at the period in which the labor share was stable — roughly from the end of World War II to the late 1980s — by breaking it down by sector. In doing so, we will understand the logic behind the “bit of a miracle” quip. The cutoff date is necessarily 1987, since the industry classification changed in that year. Fortunately, it is also the approximate end date of the stable period for the labor share.
大约从二战结束一直到1980年代末这一时期的美国劳动收入占比一直都很稳定。现在我们来分阶段地仔细审视一下这个时期。这将有助理解这个“小小奇迹”背后的逻辑。我们只能将这一时期的终点选在1987年,因为在1987年,行业的划分标准发生了变化。幸运的是,这一年也恰好几乎是劳动收入占比保持稳定的时代终结的年份。
Since the end of WWII, the U.S. has gone through large structural changes to its sectorial composition. The most significant was the shift from manufacturing to services. In 1950, manufacturing accounted for more than two-thirds of the non-farm business sector. By 1987, manufacturing was just half of the non-farm business sector. Over the same period, services increased from 21 percent to 40 percent of the non-farm business sector.
自从二战结束后,美国经济的产业构成经历了巨大的结构性变化。最明显的变化是经济从制造业向服务业的转型。在1950年,制造业在非农经济中占据的比重超过了三分之二。而到1987年,制造业在非农经济中仅仅占据了一半的比重。同一时期,服务业在非农经济部门中所占的比重则从21%提升到了40%[ix]。
The reader would not be surprised to learn that different sectors use labor and capital in different proportions. In 1950, the manufacturing sector averaged a labor share of 62 percent, with some sub-sectors having even higher labor shares, such as durable goods manufacturing, with a labor share of 77 percent. Services instead relied more on capital and thus had lower labor shares: an average of 48 percent.
对于不同的经济部门中劳动和资本的构成比例不同这一点,相信读者们并不会感到吃惊。在1950年,制造业部门中的平均劳动收入占比是62%,而其中某些子部门的劳动收入占比还要更高,例如在耐用品制造业中,劳动收入占比到了77%[x]。与之相反,服务业则更加依赖于资本,因而其劳动收入占比也更低:平均水平是48%。
Thus, from 1950 to 1987, the sector with a high labor share (manufacturing) was cut in half, while the sector with a low labor share (services) doubled. The aggregate labor share is, naturally, the weighted average across these sectors. Therefore, we would have expected the aggregate labor share to fall. But as we already know, it did not.
也就是说,从1950年到1987年间,劳动收入占比较高的部门(制造业)在经济中的占比下降了接近一半,而劳动收入占比较低的部门(服务业)在经济中的占比则上升了一倍。加总的劳动收入占比很自然地应该等于不同部门劳动收入占比的加权平均值。既然如此,我们应该可以预期,加总的劳动收入占比会下降。但正如我们已经知道的,它并没有下降。
The reason is that, coincidentally with the shift from manufacturing to services, the labor share of the service sector rose sharply, from 48 percent in 1950 to 56 percent in 1987. Education and health services went from labor shares around 50 percent to the highest values in the whole economy, close to 84 percent. In manufacturing, the labor share was substantially more stable, increasing by less than 2 percentage points over the period.
而其中的原因则是在经济从制造业向服务业的转型过程中,服务业中的劳动收入占比却巧合地经历了大幅的上升,从1950年的48%上升到了1987年的56%。教育和医疗服务业中的劳动收入占比从50%左右上升到了整个经济各部门中的最高水平,接近84%[xi]。制造业中的劳动收入占比则持续保持稳定,在整个期间内上升了不到2%。
And this is the “bit of a miracle” — that the forces affecting the labor share across and within sectors just happened to cancel each other out over a period of almost half a century.
而这就是所谓的“小小奇迹”——在接近半个世纪的时间内,部门间和部门内影响劳动收入占比的各种力量恰恰抵消了各自的影响。
A BIT OF A MIRACLE NO MORE: 1987-2011
“小小奇迹”不再:1987-2011
I start by repeating the previous exercise, now over the period 1987 to 2011. As it had from 1950 to 1987, the manufacturing sector kept losing ground to the service sector, albeit at a slower rate.
下面我首先会采取和之前相同的方法来分析美国经济的劳动收入占比,只是将时间段换成1987年-2011年。和1950年-1987年间一样,尽管速度有所下降,但制造业部门在经济中的占比仍然持续被服务业部门所抢占。
By 2011, services accounted for more than two-thirds of U.S. economic output and an even larger fraction of total employment. However, the differences in the labor share between the two sectors were much smaller by the early 1990s, and thus the shift from manufacturing to services had only small downward effects on the overall labor share.
到2011年,服务业在美国经济总产出中所占的比重已经超过了三分之二,而在总就业中的占比甚至更高。然而这两个部门之间劳动收入占比的差异相比1990年代初却缩小了不少,因此,经济从制造业向服务业的转型对总体劳动收入占比仅仅会造成很小的下行作用。
We readily find out which part of the economy is behind the decline of the labor share once we look at the change in the labor share within manufacturing, which dropped almost 10 percentage points. Virtually all the major manufacturing sub-sectors saw their labor shares fall; for non-durable goods manufacturing it dropped from 62 percent to 40 percent. The labor share within the service sector kept increasing, as it had before 1987, but very modestly, only enough to cancel the downward pressure from the shift across sectors. Indeed, had the labor share of income in manufacturing stayed constant, the overall labor share would have barely budged.
只要看看在制造业中劳动收入占比的变化,我们就能很容易地发现经济中的哪一部分是造成劳动收入占比下降的主因。在制造业中,劳动收入占比下降了接近10个百分点。基本上所有主要的制造业子部门都经历了劳动收入占比的下降。在非耐用品制造业中,劳动收入占比从62%下降到了40%。而服务业部门的劳动收入占比相对1987年之前的水平仍然保持了增长,但是增幅非常缓慢,仅仅足够抵消掉由经济从制造业向服务业转型所产生的下行压力。的确,假如制造业中的劳动收入占比能够保持不变,整体经济中的劳动收入占比就几乎不会下降。
Note that in one sense, the bit of a miracle actually continued from 1987 onward: As manufacturing continued to shrink, decreasing the share of income accruing to labor, services picked up the slack by increasing their share of income accruing to labor, albeit more modestly than before. What ended the “miracle” was the precipitous decline in the labor share within manufacturing.
从这个意义上说,“小小奇迹”实际上在1987年之后也得到了延续:制造业在整体经济中占比的持续收缩减少了总收入中劳动收入的比例,而服务业则在一定程度上通过提升部门内的劳动收入占比收拾了残局,虽然提升的速度相比之前已经减缓了许多。终结“奇迹”的实际上是制造业内部劳动收入占比的急剧下降。
Wages and productivity
工资与劳动生产率
It is worth investigating a bit further what determinants are behind the fall in the labor share within manufacturing, since it played such an important role in the decline of the overall labor share. To this end, note that the change in the labor share in a particular sector is linked to the joint evolution of wages and labor productivity.
由于制造业内部的劳动收入占比下降在整体劳动收入占比的下降中发挥了如此重要的作用,更深入地研究其中的决定因素就显得很有价值了。从这个意义上说,我们需要注意到,某个特定部门内的劳动收入占比是与工资和劳动生产率的联合演化联系在一起的。
Consider a machine operator working in a factory for one hour to produce goods that will have a gross value to the factory owner of $100. If he is paid $60 per hour, labor’s share is approximately 60 percent. For the labor share to change, there are only two possibilities: Either the value of the goods produced must change or the hourly wage must. Conversely, for the labor share to stay constant, the value of the goods and the hourly wage have to move in unison.
假如一名机器操作员在工厂中工作一小时能够生产出对于工厂主而言价值100美元的产品,如果他的时薪是60美元,那么劳动收入占比就大约是60%。一旦劳动收入占比发生变化,仅仅有两种可能的情况:要么是产出的价值发生了变化,要么是操作员的时薪发生了变化。反过来说,如果劳动收入占比保持不变,产出的价值和操作员的时薪就必须总是等比例变化[xii]。
So which one — productivity or wages — brought down the labor share in manufacturing? Fortunately, we do have reliable data on output, wage rates, and hours worked in manufacturing. Figure 4 displays the evolution of labor productivity (that is, output per hour) and wage rates from 1950 onward. Both series are set such that their value in 1949 equals 100.
那么在生产率和工资水平中,究竟是哪一项将制造业中的劳动收入占比拖了下来呢?幸运的是,我们拥有制造业中关于产出,单位时间工资和工作时长的可靠数据。图4显示了自1950年以来劳动生产率(也就是每小时产出)和单位时间工资的演化过程[xiii]。两条曲线都将1949年的水平设定为100[xiv]。

Once again we see two clearly separate periods. Until the early 1980s, labor productivity and wages grew at a very similar rate — if anything, the wage rate out-paced productivity, which, as described earlier, implies that the labor share in manufacturing inched up. By mid-1985, labor productivity took off, while wage growth was very sluggish. Since then, the gap between productivity and wages has kept growing, depressing the labor share.
我们又一次地看到了两个被明显分隔开的时期。直到上世纪80年代早期,劳动生产率和工资都一直在以很接近的速度增长——如果有不同的话,也是工资的增长速度超过了劳动生产率。按照之前的描述,这意味着制造业中的劳动收入占比提高了。到上世纪80年代中期,劳动生产率开始突飞猛进,而工资的增长则变得非常缓慢。从那以后,劳动生产率和工资之间的差距就开始持续扩大,从而不断压低劳动收入占比。
Because an index is used to scale both series, it is a tad difficult to grasp from the figure whether labor productivity accelerated or wage rates stagnated from the 1980s onward. The answer is both things happened. In the 1980s, productivity grew at about its long-term trend rate, but wages were virtually flat, growing less than half a percentage point a year on average over the decade. Wage growth recovered in the 1990s, but productivity actually took off, further increasing the gap. Overall, though, it appears that the fall in the labor share is explained mainly by the sluggish growth of wages rather than above-trend labor productivity.
由于我们使用同一个坐标来衡量两条曲线的变化,想要从图中分辨出1980年后究竟是劳动生产率的增长加速了还是单位时间工资的增长停滞了似乎有些困难。答案是两件事情都发生了。在1980年代,劳动生产率的增长速度基本上等于它的长期平均增长率,但是工资增长则相当平缓,这十年中的年均增长率不到0.5%。工资的增长在1990年代有所恢复,但是生产率的增长则突飞猛进,让两者间的差距越来越大。但是整体看来,劳动收入占比的下降更为主要的原因还是缓慢的工资增长速度,而不是增长的劳动生产率。
CONCURRENT PHENOMENA
一些并发的现象
What is the ultimate cause behind the decline of the labor share in the U.S.? The honest answer is that economists have several hypotheses but no definite answer yet. Rather than go over the sometimes-intricate theories behind these hypotheses, I will discuss the main observation or phenomenon anchoring each one.
美国劳动收入占比下降背后的终极原因到底是什么?诚实的回答是,经济学家们目前只是提出了一些假说,但还没有得到确定的答案[xv]。在本文中,我并不准备把这些假说背后的那些有时看起来错综复杂的理论复述一遍,而将讨论与每个假说相关的主要观察结果或现象。
Capital deepening
资本深化
This is by far the most popular hypothesis: Workers have been replaced by equipment and software. Who has not seen footage of robots working an auto assembly line? Older readers may remember when live tellers and not ATMs dispensed cash at banks. Software is now capable of piloting planes and, even more amazingly, doing our taxes!
这是至今为止最流行的假说:工人正在不断地被设备和软件所替代。今天谁还没有见过机器人在汽车流水线上的身影呢?年纪大一些的读者们可能还记得,在过去银行是使用出纳员而不是ATM机来分发现金的。当时的软件还不具备为飞机导航的能力,而更令今人惊讶的是,它们甚至还无法计算我们的税单!
There is more behind this hypothesis than anecdotes. Loukas Karabarbounis and Brent Neiman document a fall in equipment prices. Lawrence Summers proposes that capital should be viewed as at least a partial substitute for labor — more and more so as technology develops. In both models, the idea is similar: Better or cheaper equipment replaces workers and redistributes income from labor to capital. The result is that production becomes more intensive in capital, which is why these theories are often referred to as capital deepening.
这个假说背后有着远比这些旧日轶闻深刻得多的内容。Loukas Karabarbounis和Brent Neiman证明了设备价格的下降趋势。Lawrance Summers则提出,资本至少应该被看作劳动力的一种部分替代——而随着技术的发展,替代的程度也越来越高。在这两个模型中,观点是相似的:更好或者更便宜的设备替代了工人的劳动,并且将之前属于劳动的一部分收入重新分配给了资本。结果就是生产过程的资本密集程度越来越高,这也是这些理论通常被人们称为“资本深化”的原因。
It is important to understand that the capital deepening mechanism must operate at the level of the overall economy. So, when we see a robot replace, say, five workers, we need to remember that the production of the robot itself involved workers, so we are swapping auto assemblers with robot assemblers. It is, of course, still possible that the robot tilts income toward capital, but it is not a foregone conclusion.
重要的是,我们必须懂得资本深化机制只有在整体经济的尺度上才能发挥作用。所以当我们看到一个机器人替代了5名工人时,我们应该记住,机器人的生产本身也需要工人,所以我们只是把汽车装配工换成了机器人装配工而已。当然,机器人的确很有可能会让收入的天平向资本倾斜,但这并非已成定局。
The main challenge to capital deepening is that if a sector is substituting robots for workers to save money or improve the quality of the good being produced, the remaining workers should therefore become more productive and, overall, the sector should be expanding. In other words, capital deepening can reduce the labor share of income, but it does so by making labor productivity accelerate rather than making wages stagnate. As we saw earlier, this does not fit the actual picture of the manufacturing sector at all.
对资本深化理论的主要挑战是,如果某个部门通过使用机器人代替工人来节省成本或者提高所生产的产品质量,那么剩下的工人的生产效率就应该变得更高,而在整体上,这个部门应该会在扩张之中。换句话说,资本深化会降低劳动在总收入中所占的比例,但这是通过让劳动生产率获得提升来完成的,而不是让工资的增长停滞。就像我们之前所看到的,这与制造业所呈现的实际图景完全不相符[xvi]。
Income inequality
收入不平等
The increase in income inequality in the U.S. has lately received a lot of attention. The decline of the labor share is a force toward income inequality because capital is more concentrated across households than labor is.
最近,美国收入不平等的加剧获得了大量的关注。劳动收入占比下降显然是一种加剧收入不平等的力量,因为相比劳动力,资本在家庭间的分布集中度显然更高[xvii]。
It should be noted, though, that the main driver of the increase in income inequality is not capital income but rather wages themselves, particularly at the very top of the pay ladder. As Elsby and his coauthors document, the increase in top wages has actually sustained the labor share. In other words, the decline in the labor share actually understates the increase in income inequality.
但值得一提的是,收入不平等加剧的主要驱动力并不是资本收入,而是工资收入本身,尤其是在工资收入阶梯的顶端[xviii]。正如Elsby和他的合作者们所证明的,顶端工资的增长实际上会起到维持劳动收入占比的作用。换句话说,劳动收入占比的下降实际上还低估了收入不平等程度的加剧。
An interesting question is whether whatever is driving up inequality is also driving down the labor share. Several economists have proposed that technological change is skill biased — that is, it augments productivity more for highly skilled workers than for low-skilled workers. Combined with the idea that capital helps highly skilled workers be more productive but makes unskilled workers redundant, skill bias can explain both the increase in wage inequality and the decline in the labor share.
一个有趣的问题是,任何加剧收入不平等程度的因素是否也同样会降低劳动收入占比呢?一些经济学家提出,技术进步对于工人技能的影响是有偏的——也就是说,相对于低技能的工人,技术进步会更大地提升那些高技能工人的生产力。与之前得出的资本在帮助高技能工人提高生产力同时,让低技能工人变得冗余的观点相结合,“技能偏好”能够同时解释工资收入不平等程度的加剧和劳动收入占比的降低[xix]。
Let us return once more to the car manufacturer example. The robot may be replacing five unskilled workers but may require a qualified operator. The demand for unskilled workers falls, and so do their wages; but the demand for qualified operators increases, and so do their wages. So it is possible to have an increase in wage inequality while factories undergo capital deepening.
让我们再次回到汽车制造商的例子。机器人可能会替代掉5名不熟练的工人,但同时却会需要一名合格的操作员。对不熟练工人的需求下降了,他们的工资收入也会同时下降;但是对合格的操作员的需求和他们的工资水平则会同步提升。所以随着工厂经历资本深化的过程,工资收入的不平等程度也很可能会加剧。
Globalization.
全球化
Another popular hypothesis links the fall in the labor share with the advent of international trade liberalization. There is no question that there has been a substantial increase in trade by U.S. firms in the past few decades. In particular, firms have shifted parts of their production processes to foreign countries to take advantage of cheaper inputs — which, from the perspective of a country like the U.S. that has more capital than other countries, means cheap labor. Industries that are more intensive in labor, such as manufacturing, will be more likely to outsource their production processes abroad, and thus the remaining factories are likely to be the ones that rely more on capital.
另一个流行的假说将劳动收入占比的下降与国际贸易自由化的出现联系在了一起。毫无疑问,在过去的几十年中,美国公司所进行的国际贸易经历了非常显著的增长。尤其值得一提的是,许多美国公司都将它们的一部分生产流程转移到了国外以利用更加便宜的生产要素——对于美国这样一个比他国拥有更多资本的国家来说,也就是劳动力。劳动力更加密集的那些行业,例如制造业,将更有可能将生产流程外包到国外,而那些留在国内的工厂则更可能属于那些对资本依赖程度较高的行业。
Surprisingly, there is not a lot of evidence to support this view. The main challenge to the hypothesis is that U.S. exports and imports are very similar in their factor composition. That is, were trade driving down the labor share, we would observe the U.S. importing goods that use a lot of labor and exporting goods that use a lot of capital. Instead, most international trade involves exchanging goods that are very similar, such as cars.
令人吃惊的是,并没有多少证据能够支持这个观点。这一假说所面临的主要挑战是,美国的进口和出口在要素构成上其实非常相似。也就是说,如果说国际贸易降低了美国的劳动收入占比,那么我们会观察到美国所进口的产品的生产要素中包含大量的劳动,而出口产品的生产要素中则包含大量的资本。但实际上,大多数的国际贸易中所交换的产品都非常相似,例如汽车[xx]。
Another prediction of the globalization theory is that countries the U.S. exports to should see their labor shares increase and — as noted in the accompanying discussion, it appears that the decline in the labor share is a global phenomenon.
支持全球化降低了美国劳动收入占比的理论所作出的另一项预测是,那些从美国进口多于向美国出口的国家的劳动收入占比应该会上升——而我们在之前的讨论中已经提到过,劳动收入占比下降似乎是一个全球性的现象。
Some studies, though, do support this hypothesis. Elsby and his coauthors find some evidence that the labor share fell more in sectors that were more exposed to imports. There is a large body of literature on the impact of trade on wage inequality that only recently has started to consider the impact on the labor share.
事实上,也的确有一些研究支持这个假说。Elsby和他的合作者们发现了一些证据证明在那些受进口冲击更强的行业内,劳动收入占比的确下降得更厉害。已经有大量的文献研究国际贸易对于工资收入不平等的影响,而直到最近,人们才开始考虑它对于劳动收入占比的影响[xxi]。
CONCLUSIONS
结论
Despite several measurement issues and alternative definitions associated with the labor share, the message is quite clear: The 2000s witnessed an unprecedented drop in the labor share of income. Exploring the early period, we saw that the U.S. economy had been able to accommodate the surplus workers from manufacturing only until the late 1980s.
除了一些测量方法上的问题,以及与劳动收入占比相关的一些不同定义之外,我们所获得的信号是非常清晰的:21世纪的前十年见证了美国劳动收入占比的一场史无前例的急剧下降。通过对更早的时期进行研究,我们发现直到1980年代末期,美国一直都能够容纳制造业中多余的劳动力。
We also saw that the stagnation of wages, rather than accelerated labor productivity, has been behind the drop in the labor share from 2000 onward. The review of possible hypotheses behind the decline in the U.S. labor share was, admittedly, quite inconclusive: Economists do not yet have a full grasp of the underlying determinants.
我们还发现,工资增长的停滞,而不是劳动力产出的提升,才是2000年之后劳动收入占比下降的主要原因。需要承认的是,对于一些可能解释美国劳动收入占比下降的假说的回顾并没有得出什么明确的结论:经济学家们仍然没能完整地把握这一现象背后的那些潜在因素。
[](#_ednref1)
[i] 收入中的一小部分实际上直接被政府获取了,我将在之后更详细地讨论这一点。
[ii] 关于NIPA,国家经济分析局提供了多种入门级别的指导教程,可通过访问http://www.bea.gov轻松获得。
[iii] 折旧和税收也分别会遇上一些测量方法上的问题,但我们可以安全地规避它们:本文附带的讨论《其它测量方法上的挑战》对这些额外的问题进行了简要的描述。还可参阅Paul Gomme和Peter Rupert发表于2004年的论文,以获得对所有劳动收入测量方法问题的完整描述。
[iv] 实际上其中还包括一些其它的小成分:例如非盈利机构的收入等。
[v] 国家劳动统计局所采用的方法实际上远非完美:例如,一些岗位上受雇佣劳工的比例可能远高于自雇人员,而这可能导致一些误导性的结果。
[vi] 国家劳动统计局使用的主流劳动收入占比,也被称为“头条劳动收入占比”,包含了所有行业的劳动收入占比数据。可访问http://www.bls.gov/lpc/lpcmethods.htm以了解该测量方法的构建细节。
[vii] 劳动收入占比也会表现出一定的弱周期性,在经济下滑时劳动收入占比通常会上升。但本文关注的焦点是劳动收入占比的长期趋势。
[viii] 需要说明的是,我们只考虑非金融企业。金融部门的收入不稳定是众所周知的,并且存在一些与其自身相关的测量问题——即股票期权和类似的一些支付手段常常被作为支付劳动报酬的方式。
[ix] 这里的占比数据指的是占总经济增加值的比重。与此同时,就业人口的比例结构也发生了类似幅度的转变。在这个时期内,农业部门也经历了相当严重的收缩。
[x] 数据来源于Michael Elsby, Bart Hobijn,和Aysegul Sahin三位作者2013年的论文。这里的劳动收入占比指的是所有受雇劳工的劳动报酬占总经济增加值的比例。
[xi] 服务业中劳动收入占比的提升与William Baumol提出的“服务业的支出病”这一可追溯到上世纪60年代的概念有关,它指的是生产率在服务业中提升的难度本身就较高。可参阅Baumol 2012年的论文获取他最新的观点。
[xii] 这里的计算忽略了之前所提到过的对经营者收入的分解。不过对于制造业部门来说,经营者的收入本来也不会很高。
[xiii] 单位时间“工资”实际上也包含了福利和奖金,它们在总的劳动报酬中所占的比重一直在增加。
[xiv] 图4采纳了Susan Fleck, John Glaser和Shawn Sprague 2011年发表的论文中使用的方法,按照制造业产出的隐含价格指数对于产出的数值进行调整,并按照消费者价格指数对工资率的数值进行调整。
[xv] 一些同行可能会认为“还没有”这个说法并不是很诚实,因为对于经济学家们而言,在他们面临的任何问题面前,他们总是会提出一系列的假说,而得不到确定性的答案。
[xvi] 公平地说,上世纪90年代的情形并不是很符合这个理论,因为劳动生产率的提升在这个阶段的确加速了,而劳动收入占比的下降主要发生在本世纪的前十年中。参阅原文第6页对于技术和工资差异把高技能劳工和低技能劳工区分开来的讨论。
[xvii] 可参阅Margaret Jacobson和Filippo Occhino 2012年的论文对于劳动收入占比对收入不平等影响的研究。
[xviii] 可参阅Thomas Piketty和Emmanuel Saez 2003年的论文以及Facundo Alvaredo, Anthony Atkinson, Piketty和Saez 2013年的论文。
[xix] 学术界关于技术进步对于工人技能的有偏影响以及技能和资本的互补关系这两个论题已经作了大量的研究,Lawrance Katz和Kevin Murphy 1992年的论文,Per Krussel及合作者2002年的论文是这些领域重要的参考文献,但是两篇文章的技术性都很强。可以参阅Keith Sil 2002年发表在《商业评论》上的文章,以获得关于这些问题的更易于理解的讨论。
[xx] 最初观察到这个现象的是Wassily Leontif。可参阅Daniel Trefler 1993年的论文以获得使用更新的数据对国际贸易的要素内容的评估结果。然而,也有一些研究结果挑战他得到的结论,例如可参阅John Romalis 2004年的文章。
[xxi] Avraham Ebenstein及其合作者2013年的论文是一个典型的例子。若想获得对于之前研究结果的综述,可参考Stephen Golub 1998年的论文。
翻译:Veidt(@Veidt)
校对:混乱阈值(@混乱阈值)
编辑:辉格@whigzhou