Tails of Great Soccer Players
伟大足球运动员的窄尾分布
Isn’t it strange that the Chinese aren’t world champions in every single team sport? Here’s why it’s strange: China has 19% of the world’s population. For individual sports that may not be a huge deal: if tennis ability and opportunity are distributed equally around the world, there would be only a 19% chance that the best tennis player hails from China and 81% that he is Swiss, Serbian, Spanish, Scottish or from any other country. It is somewhat surprising seeing the top 5 superior servers and strikers of soft springy spheres with swings of stringed racquets all come from sovereign states that start with “S”, but that’s a separate story.
中国没能在所有团队运动项目中成为世界冠军着实是件奇怪的事情。这之所以奇怪,是因为中国拥有着全世界19%的人口。对于个人运动项目来说,也许这个数字还并不算太大:如果打网球的能力和机会在全球均等地分布,那么全世界最好的网球运动员来自中国的概率仅有19%,而他来自于瑞士,塞尔维亚,西班牙,苏格兰或者任何其它国家的概率则有81%。全世界最具统治力的5名网球选手都来自于国名以“S”开头的国家这件事情的确有点令人吃惊,但那是另一件事情。
In team sports that should be different. If soccer talent was equally spread China should have on average 19 of the top 100 players in each generation, almost never less than 11. Countries like Spain, Germany and France on the other hand would expect to have 1 player in the top 100, maybe 2 or 3 if they’re lucky. That would be no match for the loaded Chinese squad. Even a top 3 player can’t dominate all by himself in a team-based sport like soccer, as evidenced by the below picture of sad Ronaldo.
在团队运动中情况则完全不同。如果踢足球的天赋在世界上均等地分布,那么平均而言,在每一代世界上最好的100名球员中,中国会拥有19个,而这个数字几乎绝不可能低于11。另一方面,西班牙,德国和法国这些国家则通常只会有1名球员进入全球前100名,即使幸运的话也最多只有2或3名。而他们的队伍应该完全无法与皆由精英组成的中国队抗衡。毕竟,即使是排名世界前3的球员也无法在足球这样的一项团队运动中靠一己之力统治比赛,下图中C罗悲伤的表情充分证明了这一点。
And yet, the Chinese team is not good at soccer, and I’m putting that milder than some. The Chinese men’s national soccer team is ranked 84th in the world, a few spots below Antigua and Barbuda – a nation with a population of 90,000. That’s roughly equal to a single neighborhood in Shanghai.
但实际上中国足球队的水平并不高,而我的这种表述方式已经比一些人温和得多了。中国男子国家足球队的世界排名是第84位,他们的积分比安提瓜和巴布达还要低上几分,而这个国家的人口仅有9万,几乎只相当于上海的一个街区。
Motivation is often brought up as an explanation: perhaps the Chinese have the talent and opportunity to play soccer, but all 1.3 billion of them choose not to. Perhaps instead of playing soccer they choose to study. Those that play soccer the least and study the most can go into medicine, and those that study hardest of all and have no room for soccer make it into top medical schools in the US.
常被提到的一个理由是动力不足:也许中国人拥有踢足球的天赋和机会,但是13亿中国人却选择不去踢。也许他们宁愿把时间花在学习上。那些踢球踢得少,读书读得多的孩子可以去学医,而那些在学习上最用功以至完全没时间踢球的孩子将在未来进入美国最好的医学院。
Certainly we don’t expect those Chinese to play soccer at all, and yet below is a group photo of the Emory University medical school soccer club. The summer I was there we played at least 4 hours a week. You can easily find me on the photo, I’m one of three non-Chinese people on the team.
显然我们不会相信中国人完全不踢足球,下面是一组埃默里大学医学院足球俱乐部的照片。在那个夏天,我每周至少在那里踢上4个小时足球。你可以轻松地在照片上找到我,我是那支球队里仅有的三名非华人球员之一。
The success of a national soccer team should depend on two factors: the pool of available players (population) and some combination of natural talent, infrastructure and opportunity that determine roughly how successful an average person in that country can be at soccer. I’ll call the combined second thing national soccer affinity, and will immediately note that it’s a huge simplification to throw so many disparate things into a single factor.
一支国家足球队的成功主要依赖于以下两个因素:可供他们选择的球员人数,还有某种天赋、基础设施和机遇的组合,这大体上决定了这个国家的普通人能在足球方面所能达到的平均高度。在后文中我会将这种组合称作一个国家的“足球亲和性”,并会很快提到将如此多不相关的东西整合到一个因子里实际上是一种极大的简化做法。
My goal is to separate the effects of population, so affinity is basically everything that’s independent of a country’s total size. I am making no guesses regarding the components of soccer affinity (maybe it’s all about having enough sunshine days for kids to play outdoors), only in the comparison between countries. The question I want to investigate is:
我的目标是将人口因素单独分离出来,所以“亲和性”这个概念基本就是所有与一个国家的人口数量不相关的因素。我也不会对“足球亲和性”这个概念的具体组成做任何的猜测(也许它只涉及有足够多晴朗的日子让孩子们在室外踢球),而仅仅是在国家之间进行比较。我想探索的问题是:
Relative to their population, which countries are the best and worst at soccer? And why?
相对于其人口数量,哪些国家在足球方面做得最好?而哪些国家又做得最差?为什么?

If we imagine that soccer affinity is normally distributed, a country’s population is the size of the bell curve and the national affinity is how far to the right on the ability axis the center of the bell curve is. The level of a country’s national team is how far on the ability axis the best 11 men and women are.
如果我们假设“足球亲和性”这个因子服从正态分布,一国的人口就是钟形曲线的面积,而一个国家的“足球亲和性”则可以被定义为钟形曲线的中心线在能力轴上的投影与原点之间的距离。而该国国家队的水平则取决于该国最优秀的11名男球员和女球员在能力轴上所处的位置。
Clearly, having a larger bell curve (more people at every level of play) and shifting the curve to the right (better players on average) should both contribute to boosting the level of the national team. The fact that there are over 15,000 Chinese for each Antiguan, and yet the soccer teams are comparable in level, presents the following puzzle:
很显然,拥有一个面积更大的钟形曲线(在各种水平上都拥有更多的人口)以及让钟形曲线向右移动(更高的球员平均水平)都有助于提升一国国家队的水平。而中国的人口是安提瓜人口的15000倍,但这两国的国家队水平却处于同一档次这一事实则向我们提出了如下的难题:
Why does it seem that national team level depends on affinity much more than on population?
为什么国家足球队的水平对“足球亲和性”的依赖程度要远远高于对人口的依赖程度?
The answer to that puzzle is: Because the tails of a normal distribution fall much faster than you think.
而这个问题的答案是:因为一个正态分布的尾部下降的速率比你想象的要快得多。
In plain(er) English: every point on a bell curve is some distance away from the middle (the mean). The further away from the mean you go the less points there are (lower curve). These distances are often measured in standard deviations, or SD, shown by the vertical red lines on the picture. On a standard bell curve, just over 68% of the points are found a distance of less than 1 SD from the mean in either direction.
更直白的就是:钟形曲线上每个点和中心(也就是平均值)都存在一个距离。与平均值的距离越远,这个水平上的点数也就越少(在曲线上就越低)。而与中心的距离通常是以标准差计的(在图中用红色的垂直线条表示)。在一个标准的钟形曲线上,有68%的点都会落在均值两端一个标准差的距离之内。

Looking naively at the familiar bell picture, it seems that the curve drops sharply over the first 2 or 3 SD to either side and then levels off around 0 when you move further away. That’s extremely misleading: the relative height of the curve actually drops faster the further out you go. It’s invisible on the chart because the line further than 3 SD out is squished very close to 0. The height of the curve at 1 SD is 4.5 times higher than that at 2 SD. The curve at 5 SD is 250 times higher than that at 6 SD and it keeps getting steeper and steeper.
如果我们直观地看一下这条熟悉的钟形曲线,看起来曲线两端在距离中心最初的两三个标准差内下降得非常快,而在之后更远的距离上就会在零附近以一种接近水平的方式缓慢下降。而这实际上会造成巨大的误导:事实上,距离中心越远,曲线的相对高度下降的速度越快。但由于在3个标准差之外,曲线被压缩到了非常接近0的高度,所以在图上我们看不到。曲线上1标准差处的高度是2标准差处的4.5倍,而5标准差处的高度则是6标准差处的250倍,而随着离中心越来越远,曲线的陡峭程度还在不断上升。
The best male soccer player in China (Zheng Zhi?) is almost literally one in a billion, which means that he’s almost 6 standard deviation better than the average Chinese. If the population of China doubled (they’re working on it!), there would be 2 players as good as Zheng is. However, if the population of China became just one standard deviation better at soccer, there would be over 200 players at least as good, and a few dozen who are much better.
中国最好的男性球员(是郑智吗?)在中国差不多是十亿里挑一了,这意味着他的水平比中国人的平均足球水平要高6个标准差。如果中国的人口增加一倍(他们的确在努力这么干!),那么中国将会出现两个和郑智一样优秀的球员。然而,如果中国人的平均足球水平能够提高一个标准差的话,那么中国就会有超过200名球员和郑智水平一样高了,而且还会有几十名球员的水平比他高得多。
It could be that a normally distributed soccer skill model is wholly wrong, but it does seem to explain some of what we see in reality. For anything that’s distributed roughly like a bell curve, the quality of the best people in a large enough group (like a country) depends much more on small differences in the average level than on large differences in total population. Hey, I wonder if that’s why so many Nobel prize winners are… gets repeatedly electrocuted
实际上这个正态分布的足球水平模型可能是完全错误的,但是它看起来的确解释了一些我们在现实中观察到的现象。对于任何一个分布接近钟形曲线的群体,在一个足够大的群体(比如一个国家)中,水平最高者的能力更多地取决于平均水平上的微小差异,而人口总数上的巨大差异所发挥作用则要小得多。嘿,现在我开始怀疑这就是为什么如此多的诺贝尔奖得主都死于触电的原因了。
Whoops, sorry about that. Let’s see this effect in action on the one trait that we can all agree is close to normally distributed and varies among nations: human height.
抱歉这个梗有点欠。让我们通过一个特征来看看这种效应的实际力量,该特征的近似正态分布得到了大家认可,而且在国家间存在差异:那就是人的身高。
The average Indian dude (sorry for the androcentrism, ladies, there’s just better data on male heights and male soccer teams) is 165 cm (5′ 5″) and there are roughly 630 million of them. The average Norwegian dude is 180 cm (5′ 11″) and there are 2.5 million. The standard deviation of male height is around 6 cm around the world. If heights were distributed in a perfect normal bell curve with those parameters they would look like:
印度6.3亿成年男性(女士们,抱歉了,这里看起来似乎有点大男子主义,但有关男性身高和男子足球队的数据质量的确更好)的平均身高是165厘米(5英尺5英寸)。而挪威250万成年男性的平均身高则是180厘米(5英尺11英寸)。全世界身高的标准差大约是6厘米。如果身高完全服从一个由这些参数构建的正态钟形分布,那么看起来将会像下图这样:

As we plot them side by side, the Indian curve completely dwarfs the Norwegian one, even for pretty tall dudes. There are 9 Indians who are exactly 180 cm (5′ 11″) tall for every Norwegian. 5′ 11″ is tall, but not super tall. The higher mean effect only kicks in for the real outliers, so let’s zoom the above plot in to the really tall dudes.
当我们把整个分布画在一起,印度的曲线看起来完全压倒了挪威的曲线,即使对于身高很高的成年男性也是这样。印度和挪威身高180(5英尺11英寸)厘米的人口数量比例是9比1。5英尺11英寸算是高了,但并不是非常高。高均值效应只有在那些真正的异常值上才会起作用,那么让我们将图上那些真的很高的成年男性所对应的部分放大看看。
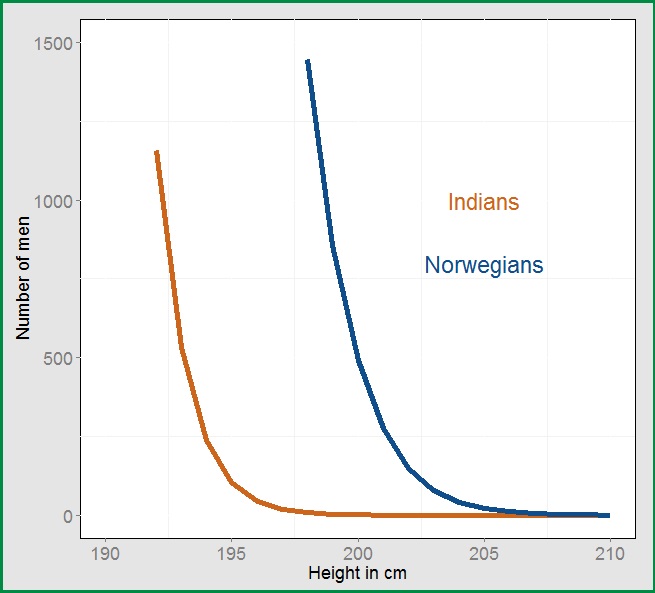
Here, the picture reverses completely. There are 100 times as many Norwegians above 195 cm (6′ 4″) as there are Indians. Under a normal distribution assumption, the tallest Indian at 6′ 7″ would only match the 1,000th tallest Norwegian.
在这里,情况完全颠倒了过来。身高超过195厘米(6英尺4英寸)的成年男性数量,挪威和印度的比例是100比1。在正态分布的假设之下,印度最高的成年男性的身高将是6英尺7英寸,而这个身高在挪威人中只能排在第1000位。
It’s important to remember that a normal bell curve is a very simplistic model, real life is messy, and Dharmendra Singh is 8′ 1″. Even inside the realm of mathematics, a normal distribution has narrower tails (the height drops faster as you get away from the mean) than most other widely used distributions that look sorta like a bell curve (like the student’s t or the gamma distributions). A normal model underestimates the number of outliers and overstates the importance of shifting the mean.
我们必须记住的是,正态分布的钟形曲线是一种非常简化的模型,真实情况要复杂得多,实际上印度最高的男性Dharmendra Singh的身高是8英尺1英寸。即使在数学王国中,相比其他大多数常用的看起来像钟形曲线的分布(例如学生t分布或gamma分布),正态分布也有着窄得多的尾部(这意味着在远离均值时,曲线下降的速度更快)。一个正态分布模型会低估异常值点的数量,同时会高估平均值移动的重要性。
With that said, my main point stands: it should not surprise anyone that the achievement of extreme performers doesn’t strongly depend on the population of a country but does on the average. There doesn’t have to be something horribly wrong with China to account for its disappointing soccer team, they could be just a little bit to the left of other countries on national soccer affinity.
但即使考虑到这些情况,我的主要观点仍然成立:那些表现极端出众的个体的出现并不太依赖于一国的人口数量,而非常依赖于该国在这方面的平均水平。中国国家足球队令人失望的表现背后也许并没有什么错得离谱的东西,这也许只是因为中国在“足球亲和性”的分布上稍微靠左了一些而已。
We still don’t know what makes up soccer affinity, just that it’s enough to explain the disconnect between populations and team performance. With the math lesson behind us comes the fun part: in the next posts we’ll rank the world’s countries by average soccer affinity, throw a bunch of data at it to see what it correlates with, and see if can get any insight into what makes countries good or bad at soccer.
我们仍然不知道“足球亲和性”是由哪些因素构成的,但它足以解释人口和团队表现之间脱节的现象。在我们的这节数学课之后才是真正有趣的部分:在接下来的几篇文章中,我们将会把世界各国按照平均的“足球亲和性”进行排名,通过一系列的数据来看看它与哪些因素相关,并试着获得一些关于是什么让一个国家在足球方面表现得好或不好的深入见解。
翻译:Veidt(@Veidt)
校对:Drunkplane(@Drunkplane-zny)
编辑:辉格@whigzhou